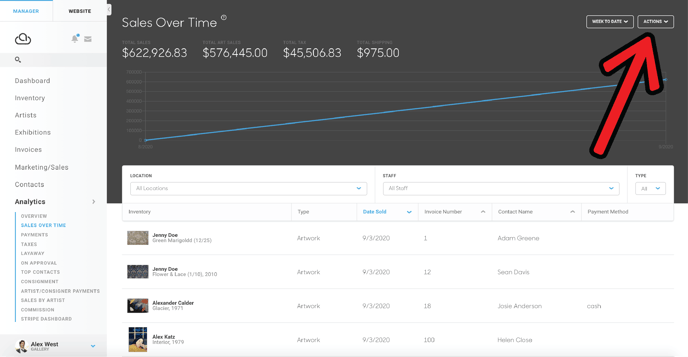
In all Analytics pages, CSV and PDF reports can be generated. In order to generate a report, click the Actions dropdown in the top-right corner of the screen.
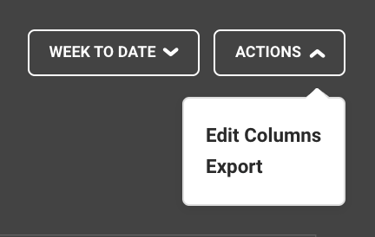
Next, click the Export option.
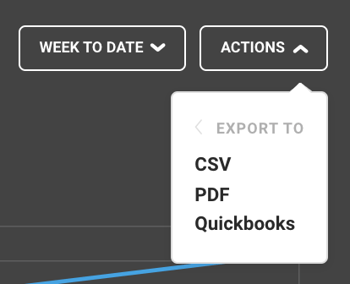
More dropdown options will appear, offering to export your report to CSV, PDF, or Quickbooks.
Customize the columns of exports and analytics panels
If you’re exporting to a CSV or PDF, a popup menu will appear, allowing you to customize the fields of your export. Fields to the right are columns that will appear in your report, and fields to the left are columns that will not. You can opt fields in or out of your export by clicking the checkboxes next to each field.
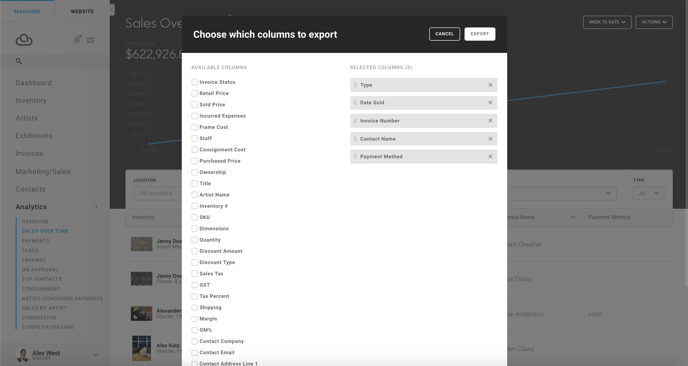
Fields can be dragged around to change the order to which they appear in their export.
The same can be performed on the display table of an export page.
Clicking the Actions dropdown and selecting the Edit Columns option generates a similar popup to the export window. Here, you can choose which fields you would like displayed and hidden in your Analytics page display table by checking and unchecking fields. Click the save button to save your changes.
Sugested Reading:
- Intro to the Analytics Panel