Quick Jump To Guide
Analytics
Analytics Tabs
Customize the Date Rage
Generate Reports
Analytics
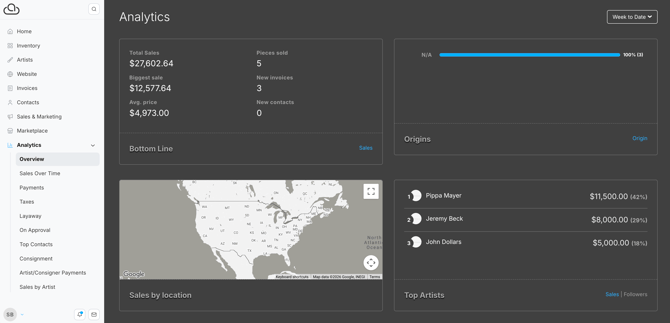
The Analytics section includes tabs that display sales-related data. The Overview tab presents a dashboard of sales analytics, including reports on sales by origin, location, and artist.
Note: Legacy gallery Manager Pro Plus, new gallery Manager Expert, and artist Manager Pro Plus accounts can also view sales funnel data. Track awareness, engagement, and revenue from the Marketplace and your website. ArtCloud also reports the sources and mediums of these purchases.
To upgrade your account, visit the Subscription page in Account Settings or contact support@artcloud.com with questions.
Analytics Tabs
Here's what each tab reports:
- Sales Over Time: Total sales, total art sales, total taxes, and total shipping.
- Payments: Net paid, pro-rated art, pro-rated tax, and pro-rated shipping.
- Taxes: Total sales, total taxable sales, and total tax.
- Layaway: Total outstanding and amount paid on layaway purchases.
- On Approval: Contacts associated with invoices with the status "On Approval."
- Top Contacts: The highest spending contacts.
- Consignment: Total sales, total consignment costs, and incurred expenses.
- Artist/Consigner Payments: Payments made to artists and consignors for the sale of their inventory.
- Sales by Artist: Inventory sold per artist.
- Commission: Total sales and commission owed to users on the account. Account admins can set users' commission amounts. Read more here: Set User Commission.
- Stripe Dashboard: Redirects to your Stripe account. Requires an integrated Stripe account. Read more about integrating Stripe here: Stripe Payment Processing.
Customize the Date Range
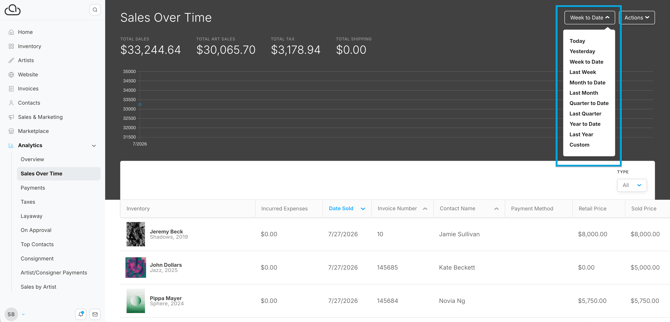
Use the date dropdown to customize the time range of sales data. Select a preset range or set a custom time frame. ArtCloud applies the selected range to all Analytics tabs.
Tip: If you don't see any sales data, check the date range. You may be viewing a period without sales.
Generate Reports
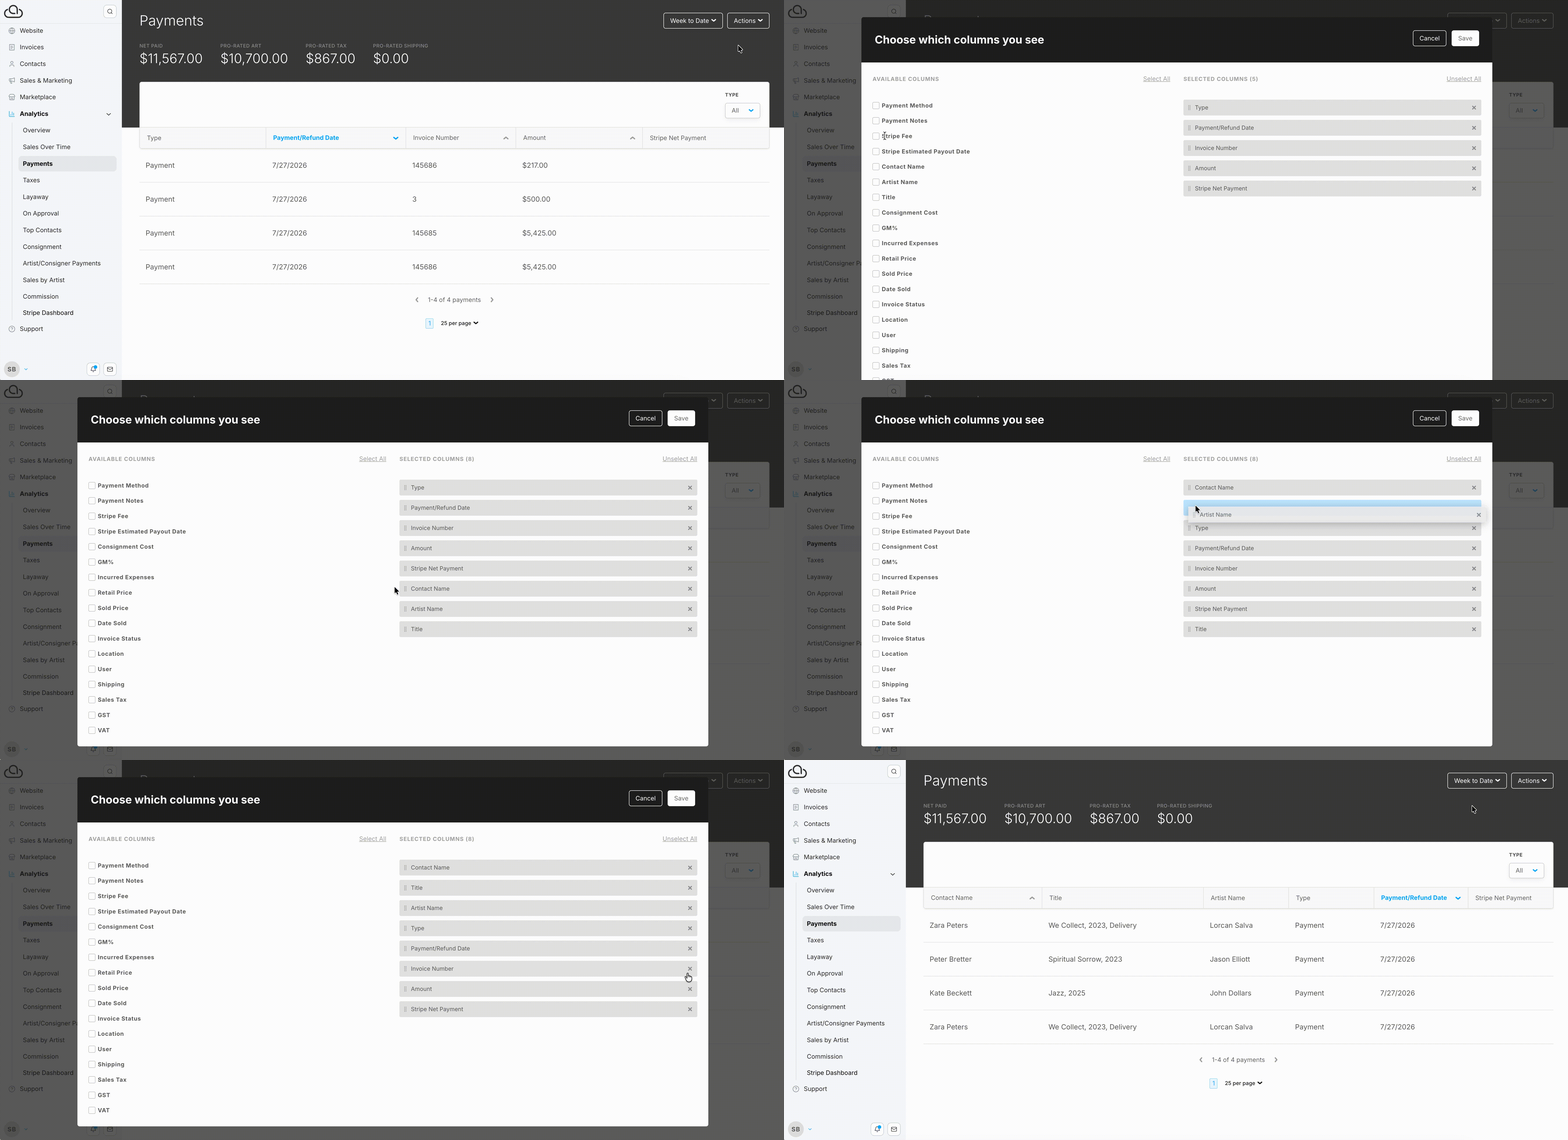
ArtCloud generates reports based on the columns in your current view. Click the Actions dropdown and select "Edit Columns" to configure the columns.
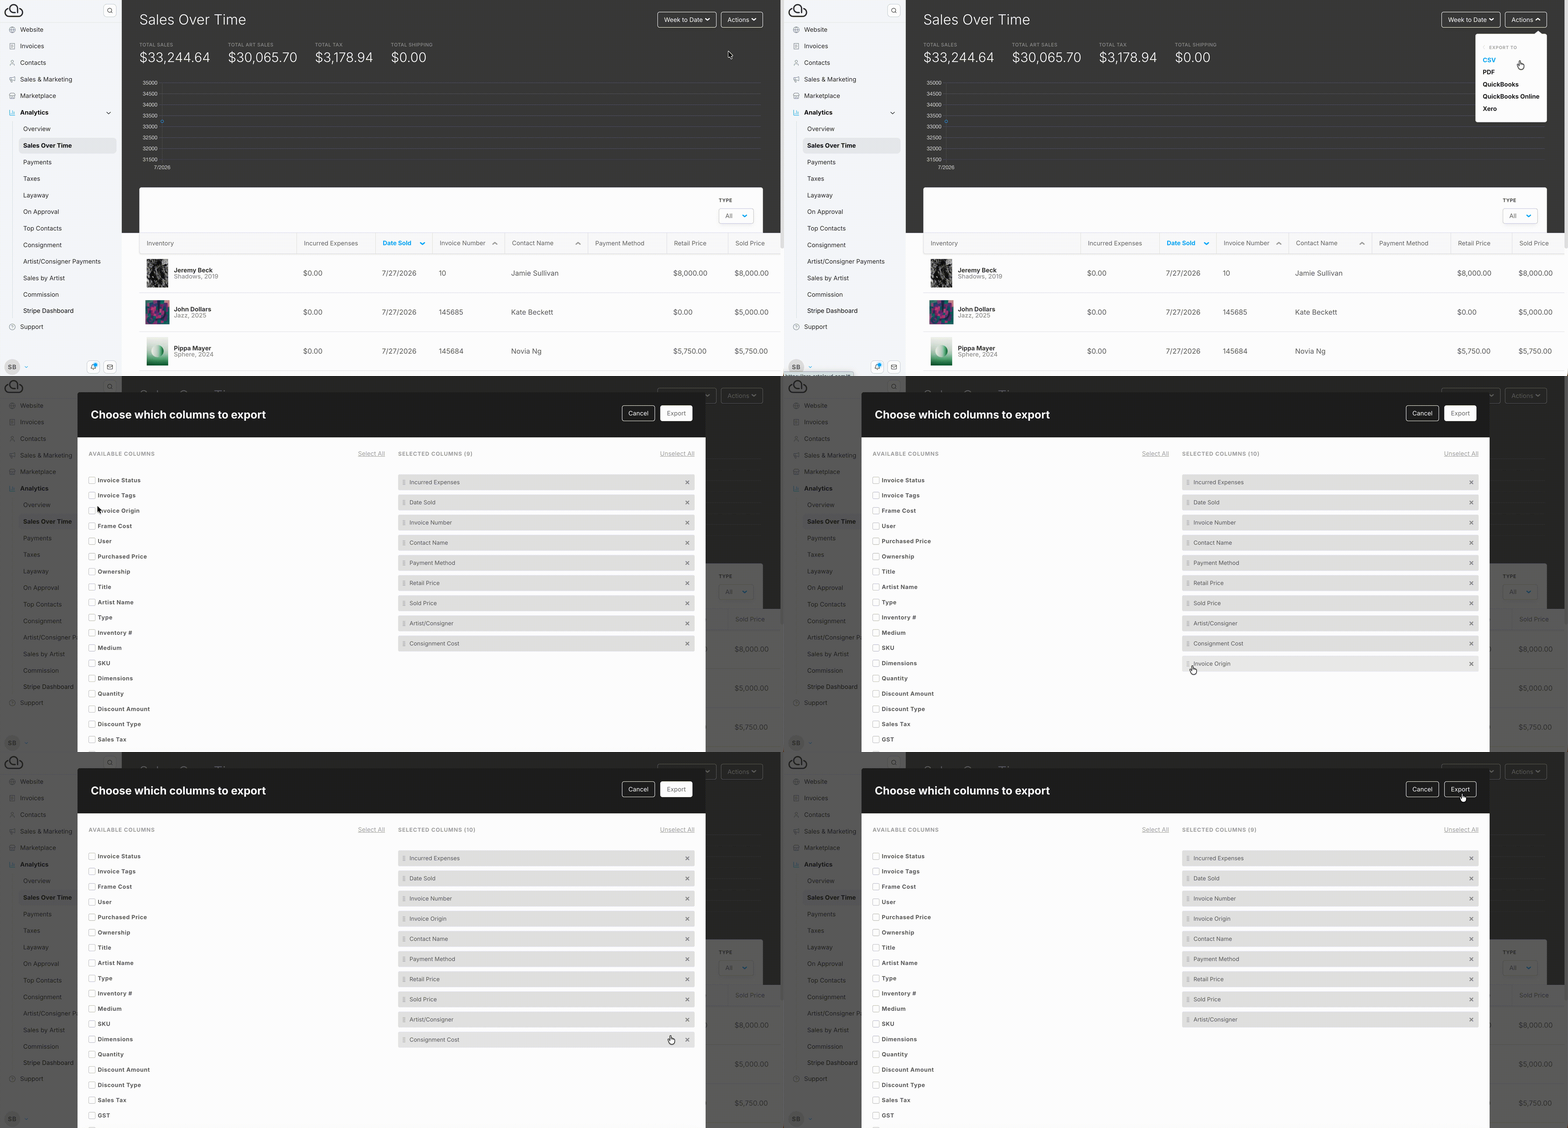
Click the Actions dropdown again and select "Export" to download the report. Pick a file type to export. The QuickBooks and Xero options download files compatible for uploading to those platforms.